TEXTILES

On shade with less water, salt and energy.

The dyeing of cotton is one of the most resource intensive stages in textile production. Achieving a target shade depends on dye dosage, salt, alkali, liquor ratio, temperature and time, and a small deviation can force a costly redye that repeats the whole process.

All case studies
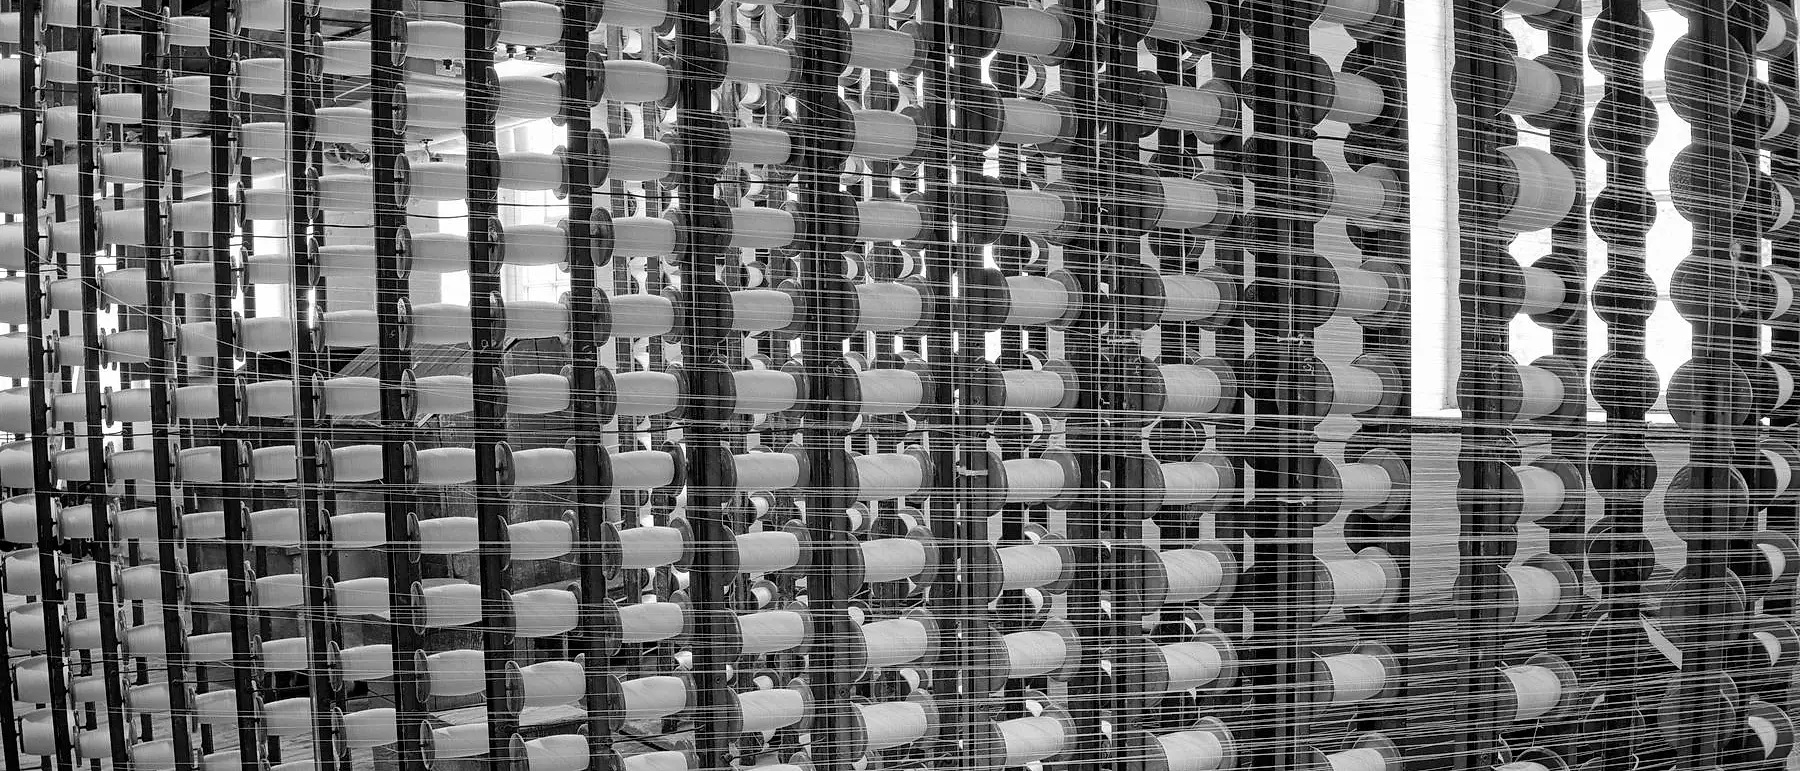
Warping creel: racks of yarn bobbins feeding threads across a mill floor
Warping creel
KEY RESULTS
−14.2%
water drawn per batch
−11.6%
thermal energy per batch
−13.8%
salt and electrolyte dosed
+8.7%
right first-time shade pass rate
−12.9%
carbon dioxide per kilogram dyed
THE PROBLEM

Small deviations force a costly redye.

The dyeing of cotton is one of the most resource intensive stages in textile production. Achieving a target shade depends on the interaction of numerous factors: dye dosage, salt concentration, alkali, liquor ratio, temperature and time. Small deviations can quickly lead to a batch being off spec and force costly redyeing or shade correction. Each redye repeats the same resource and energy intensive process.

At the same time, dyers of textiles are aiming to reduce the consumption of water, energy, chemicals and production time whilst maintaining high-quality output. These aims pull against one another.

01Shade error per batch, in sequence, against the dE 1.0 tolerance. The baseline breaches it repeatedly; the optimised recipes stay inside it.
Shade error per batch, in sequence, against the dE 1.0 tolerance. The baseline breaches it repeatedly; the optimised recipes stay inside it.
Batch, in sequenceBaselineOptimised
11.430.47
21.020.37
30.810.31
40.730.67
50.920.70
60.720.44
71.060.39
81.010.51
91.430.92
101.590.42
110.800.61
121.120.43
131.140.56
140.760.45
150.860.63
161.630.50
171.260.54
181.750.22
190.350.46
201.880.38
211.370.33
221.170.46
WHAT ENTROMETRIX DOES

A range of balanced recipes, not a single answer.

EntroMetrix builds on a textile producer's own historical batch records, laboratory dips and continuous plant logs to optimise production. We learn and model how the various inputs influence the dyeing process and the resources required for each batch, given the reality of the machines at hand. Our model then proposes recipes and dosing schedules that achieve the target shade whilst also lowering water, chemical and energy use. Rather than returning a single answer, the agent balances its findings across the competing objectives and surfaces an ideal curve, so a plant can select an operating point that suits its current priorities.

HOW IT WORKS
Analyses the data: trains on the existing batch records, dips and plant logs, with no new trials needed to start.
Creates the model: builds digital twins that simulate and predict exhaustion, fixation, colour strength and resource cost.
Discovers the ideal: understands granularly and comprehensively how to balance shade accuracy against water, salt and energy given the conditions of a particular plant.
Provides the optimum: returns a range of balanced recipes rather than one, so you can choose your own operating point.
02Every candidate recipe the model evaluated, plotted by resource cost against right first-time accuracy. The Pareto front is the ideal curve: the plant picks its operating point along it. The current recipe sits below it and to the right.
Every candidate recipe the model evaluated, plotted by resource cost against right first-time accuracy. The Pareto front is the ideal curve: the plant picks its operating point along it. The current recipe sits below it and to the right.
Current recipe1.0290.0%
Chosen operating point0.8795.2%
BUILT ON THE DATA YOU ALREADY HOLD

Built in weeks, on data the plant already holds.

EntroMetrix can be built on your plant in weeks because it uses the data your plant already holds: historical batch cards, dyebath dosing logs, laboratory dip readings, colour measurements, the standing recipes and the operating limits. We work with you to make sure any key assumptions we make in building our models are not only documented but confirmed by your plant's experts before any recommendation is made.

DEMONSTRATED ON A REACTIVE DYEHOUSE

Our approach has been demonstrated on a reactive dyeing and finishing operation. Our models learned exhaustion, fixation, colour strength and shade from the recipe inputs at this plant to an accuracy of 0.98 on just twenty-seven runs. This was enough to map the process response before optimisation began. Given the quality of the data provided in this case, we converged on an optimum range for dyeing operations in under fifteen seconds.

03Weighted multi-objective reward per training episode. The learned policy clears current practice within forty episodes and converges by episode 190; on this plant's data the whole optimisation ran in under fifteen seconds.
Weighted multi-objective reward per training episode. The learned policy clears current practice within forty episodes and converges by episode 190; on this plant's data the whole optimisation ran in under fifteen seconds.
Training episodeLearned policy
00.20
100.25
200.33
300.42
400.52
500.58
600.62
700.72
800.74
900.78
1000.82
1100.84
1200.86
1300.87
1500.88
1700.89
1900.90
2200.90
2500.90
2800.91
3000.91
Current practice0.46
VALIDATION

Blind validation before any recipe reaches the floor.

Validation was retrospective and blind. Recommendations were checked against past batches using success criteria agreed in advance, and every candidate recipe was confirmed on a laboratory dip before it reached bulk production. Optimisation stayed inside the plant's proven process window and dosing constraints, and the colourist reviews and approves each recipe, so judgement stays in house. As new batches are dyed, they feed data back into the models, refining the results already achieved.

HOW YOU MAINTAIN CONTROL
Your recipes: our recommendations are checked against your past batches before any recipe reaches the floor.
Your safe operating limits: optimisation stays within your plant's proven process window and dosing constraints.
Your laboratory dip check: the output from our recommendations is confirmed by lab dips carried out by you before bulk production.
Your expertise: your colourists review and approve each proposed recipe.
Your tracking and data: salt, chemical and water reductions, or whatever you are seeking to measure, are logged at your convenience.
04Share of batches passing shade on the first dip, and the share needing a redye, baseline against optimised.
Share of batches passing shade on the first dip, and the share needing a redye, baseline against optimised.
BaselineOptimised
First-pass shade pass8593
Redye share157
OUTCOMES

Less waste, shorter batches, lower emissions.

Less waste

Excess use of chemicals stopped, and the right first-time rate raised significantly.

Scope 1 and 2 goals

Clear steps made towards reducing energy consumption and emissions.

Shorter batch times

Across pale, medium and dark shades, batch cycle time fell by an average of 12.5%: 6.5 to 5.8 hours, 8.2 to 7.1, and 10.4 to 9.0.

05Batch cycle time by shade depth, current against optimised: 12.5% shorter on average.
Batch cycle time by shade depth, current against optimised: 12.5% shorter on average.
CurrentOptimised
Pale6.55.8
Medium8.27.1
Dark10.49
06Water, energy, salt and carbon dioxide per kilogram dyed, indexed to the baseline at 100.
Water, energy, salt and carbon dioxide per kilogram dyed, indexed to the baseline at 100.
BaselineOptimised
Water10086
Energy10088
Salt10086
CO210087

See what the model finds in your plant.

A short call with our engineering team, your process data stays on site.