CHEMICALS

Energy and carbon optimisation on the crude distillation unit.

The crude distillation unit is the largest single energy user on a refinery and one of its leading scope one carbon sources. Firing, heat recovery, stripping steam, pressure and cut points all interact, so operators run to conservative set points with margin in hand, and that margin costs energy and carbon on every barrel.

All case studies
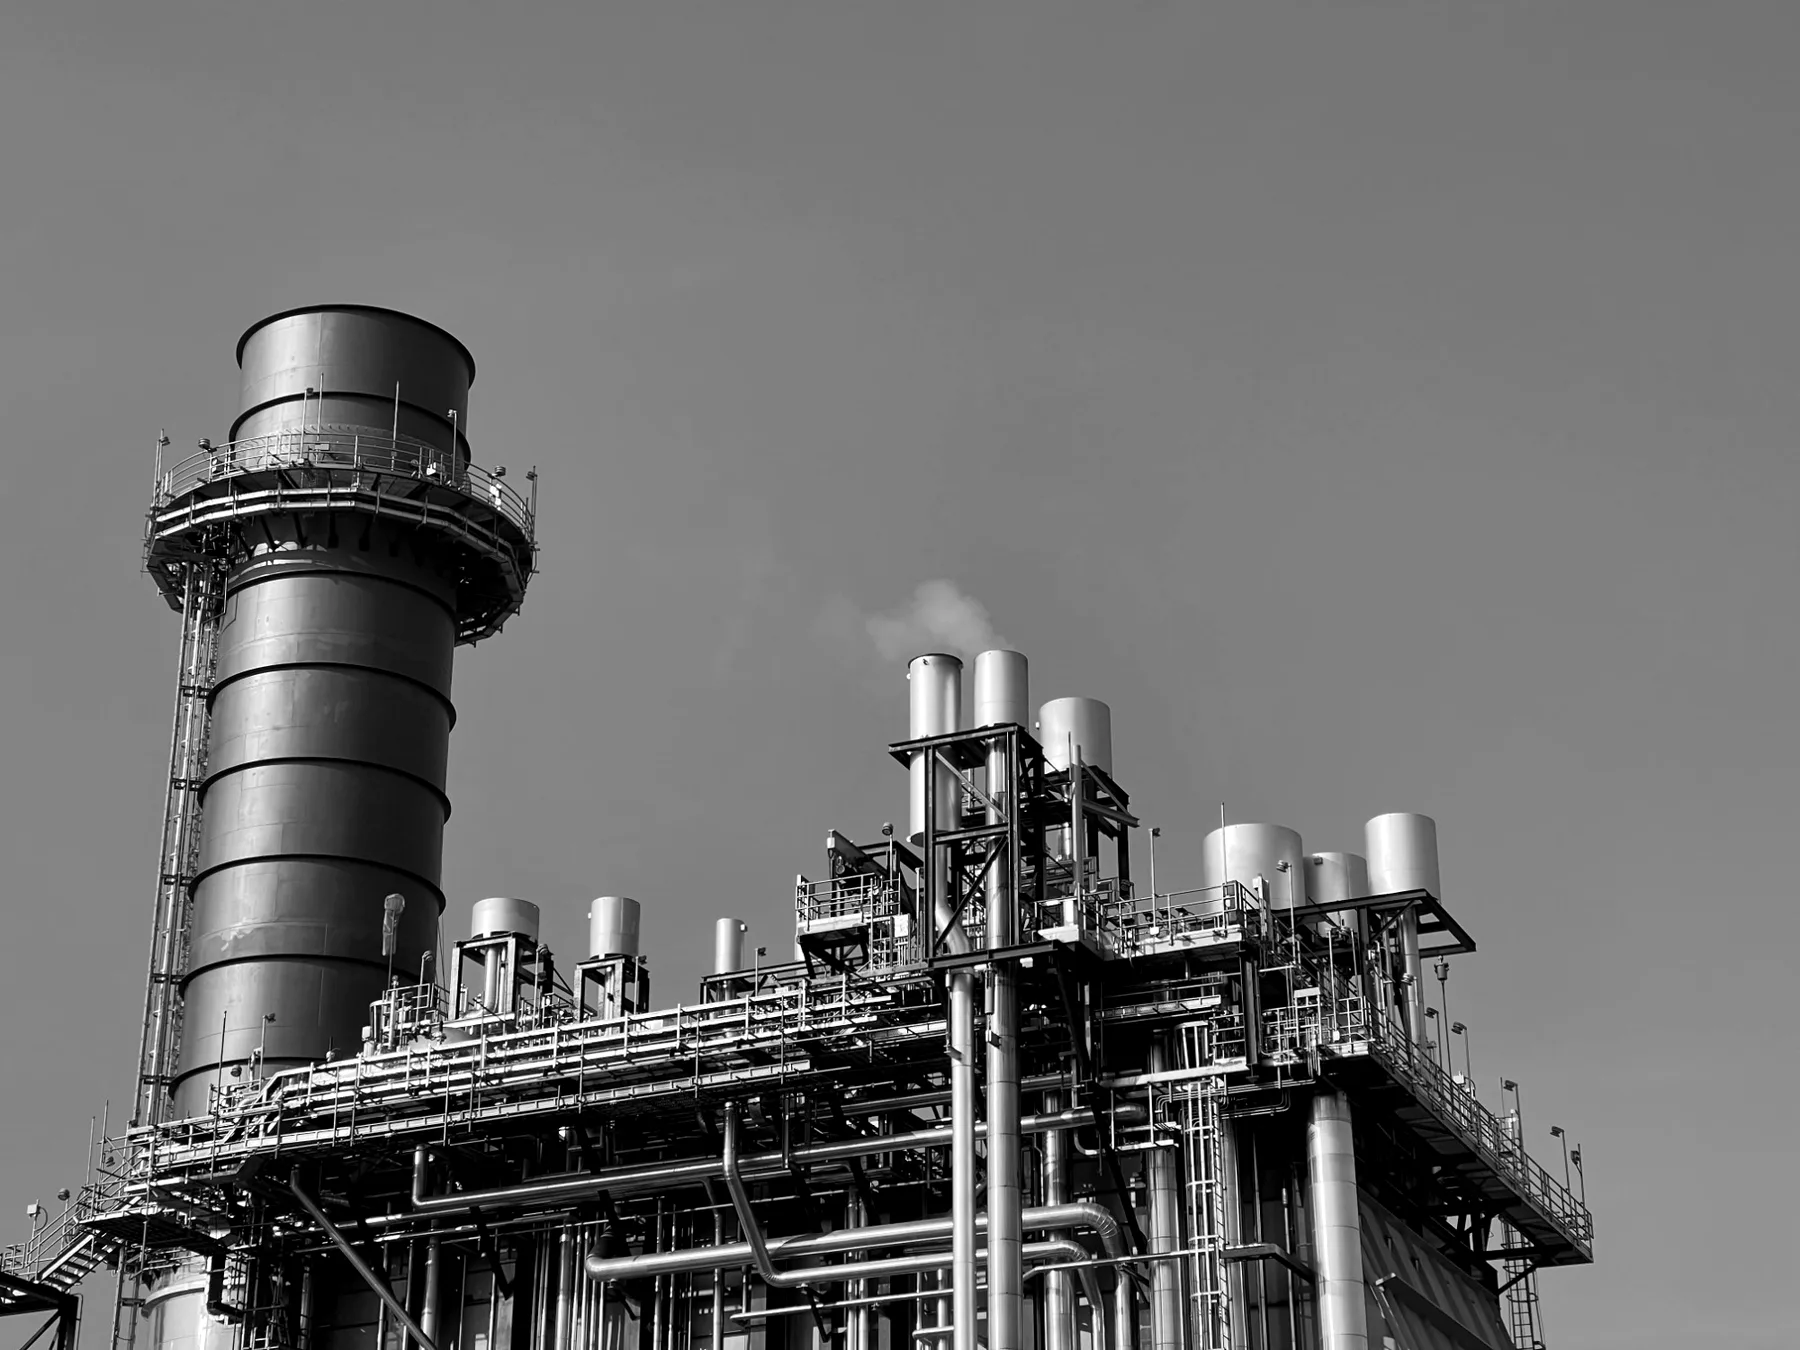
Process unit stack and pipe racks against the sky, in black and white
Stack and pipework
KEY RESULTS
−5.2%
energy consumed per barrel
−4.6%
carbon dioxide per barrel
−6.8%
fired heater fuel
−9.4%
stripping steam
−3.7%
product quality giveaway
15 to 20%

of total refinery carbon dioxide is attributable to the crude distillation unit, one of its leading scope one sources

73%

of the column heat is recovered by the preheat train before the fired heater fires, so the rest sets the fuel and carbon bill

under 3%

model deviation against the plant's own measured temperatures, so its account of the energy and carbon can be trusted

THE PROBLEM

Margin in hand costs energy and carbon on every barrel.

The crude distillation unit is the largest single energy user on a refinery and one of its leading scope one carbon sources, because most of the heat a barrel needs is raised by burning fuel in the fired heater. Firing rate and excess air, pump around heat recovery, preflash and feed preheat, stripping steam, column pressure and cut points all interact, so a move that protects one product specification can quietly waste fuel elsewhere. To hold every specification safely across changing crude slates, operators run to conservative fixed set points with margin in hand. That margin costs energy and carbon on every barrel, and routine historian trends do not show where it is being lost or how much could be recovered without breaching a specification.

01Where the unit destroys useful energy, from the exergy analysis, as a share of the total. The main column and the coolers and condenser account for three quarters of it, so that is where the levers act first.
Where the unit destroys useful energy, from the exergy analysis, as a share of the total. The main column and the coolers and condenser account for three quarters of it, so that is where the levers act first.
Exergy destruction (% of total)
Main column42%
Coolers and condenser32%
Pump arounds10%
Exchanger network8%
Fired heater5%
Preflash3%
WHAT THE MODEL DOES

A Pareto set of policies, not a single answer.

EntroMetrix builds a physics informed machine learning model of the unit's energy and carbon from the plant's own historian data, combining first principles heat and mass balances with learned corrections, then takes an exergy view to locate where useful energy is destroyed rather than where it merely flows. A reinforcement learning agent works against that model and continuously trims the operating levers, furnace excess air and firing, pump around duties, preflash and stripping steam, pressure and cut points, to lower energy per barrel and carbon while every product specification is held and the unit stays inside its safe operating window. Rather than a single answer it returns a Pareto set of policies that trade energy and carbon against throughput and product value, and the plant chooses the point it wants.

HOW IT WORKS
Physics informed ML: a physics informed machine learning model of the unit's energy and carbon, built from the plant's own historian data with no new sensors needed to start.
Exergy view: a second law analysis locates where useful energy is destroyed, so effort goes where the loss is.
Levers: furnace firing and excess air, pump around duties, preflash and preheat, stripping steam, pressure and cut points.
Multi objective reward: energy and carbon per barrel are the reward, weighed against throughput and product value.
Specifications held: product boiling points and quality are constraints, pushed toward their efficient limits, never past them.
Pareto set: the agent returns a set of policies on the frontier and the plant selects the point it prefers.
02Every operating policy the agent evaluated, plotted by carbon dioxide per barrel against throughput as a share of design. The emissions frontier is the ideal curve and the plant chooses its point along it. The fixed set points sit below it and to the right.
Every operating policy the agent evaluated, plotted by carbon dioxide per barrel against throughput as a share of design. The emissions frontier is the ideal curve and the plant chooses its point along it. The fixed set points sit below it and to the right.
Fixed set points1.0697.4%
Chosen policy0.8997.9%
BUILT ON THE DATA YOU ALREADY HOLD

Built from the historian, validated to within three percent.

The model is built from data the plant already holds. Historian records of temperatures, flows, duties and fuel across the crude unit are enough to build an energy and carbon picture of the process, and a second law, or exergy, view then shows where that energy is destroyed rather than merely where it flows. The operating limits and product specifications are set with the plant's own engineers before any recommendation is made.

DEMONSTRATED ON A CRUDE UNIT

On a crude distillation unit modelled and validated to within about three percent of measured temperatures, the optimised policy lowered energy per barrel by about five percent and carbon per barrel by a similar margin, chiefly by trimming fired heater firing and excess air and by tightening stripping steam, while holding every product specification. Most of the saving came from a small number of levers, so the value is reached with instruments the plant already has.

03Energy, carbon dioxide, heater fuel and stripping steam per barrel, the fixed set points against the optimised policy, indexed to the fixed set points at 100.
Energy, carbon dioxide, heater fuel and stripping steam per barrel, the fixed set points against the optimised policy, indexed to the fixed set points at 100.
Fixed set pointsOptimised policy
Energy10094.8
CO210095.4
Heater fuel10093.2
Stripping steam10090.6
VALIDATION

Retrospective and offline first, before any set point reaches the board.

The work is retrospective and offline first. The agent is trained against a fast physics informed surrogate of the unit and tested against operating history before any set point is suggested, and its policy is constrained to product specifications and the safe operating window, so proposals stay operable. Nothing connects to the control system in the proof phase, and the agent's own critic flags when a crude slate change has moved the unit and a refit is due.

HOW YOU MAINTAIN CONTROL
Retrospective: learned and tested against operating history first, before any set point reaches the board.
Offline and isolated: the model runs against a copy of the process, with no connection to control systems in the proof phase.
Fast surrogate: a physics informed surrogate of the rigorous model gives a safe, quick training environment.
Safe operating window: the policy is constrained to product specifications and the safe window, so proposals stay operable.
Drift monitor: the agent's own critic flags when a crude slate change has moved the unit and a refit is due.
Field readiness: full scale reinforcement learning control loops on crude units already exist as evidence.
04Specific energy per barrel across a 24 month run, drawn as a monthly path. Current practice drifts up as heat recovery declines, above its run mean of 103.8; the optimised policy holds below the run mean throughout.
Specific energy per barrel across a 24 month run, drawn as a monthly path. Current practice drifts up as heat recovery declines, above its run mean of 103.8; the optimised policy holds below the run mean throughout.
Months in runCurrent practiceOptimised policy
0100.596.0
1101.597.0
2100.596.5
3102.595.5
4104.596.5
5103.596.0
6102.095.0
7102.594.0
8102.095.0
9100.594.5
10101.094.0
11103.095.0
12103.596.0
13102.096.5
14104.096.5
15106.097.0
16106.597.5
17106.098.5
18107.596.5
19108.096.0
20106.596.5
21106.596.5
22106.596.0
23106.594.0
24106.095.5
Run mean, current103.8
OUTCOMES

Lower energy and carbon per barrel.

Held below the run mean

Current practice drifts up as heat recovery declines and crude varies; the optimised policy holds specific energy per barrel below the run mean, so the gap widens through the run.

Carbon avoided accumulates

Monthly avoided firing rises and falls with crude slate and rate and grows as the gap widens, so the total curves upward to a plant scale figure.

A few levers carry the saving

Furnace firing and excess air is the largest lever, ahead of pump around recovery and stripping steam, so effort and instruments follow the value.

05Carbon dioxide avoided across the run, accumulating month by month. The monthly saving grows as the gap widens, so the total curves upward to 17.8 kilotonnes.
Carbon dioxide avoided across the run, accumulating month by month. The monthly saving grows as the gap widens, so the total curves upward to 17.8 kilotonnes.
Months in runCumulative CO2 avoided (kt)
00.0
20.7
41.7
62.8
83.9
105.0
126.2
147.5
169.4
1811.5
2013.6
2215.7
2417.8
06Where the saving comes from, by lever. Furnace firing and excess air carries the largest share, ahead of pump around recovery and stripping steam.
Where the saving comes from, by lever. Furnace firing and excess air carries the largest share, ahead of pump around recovery and stripping steam.
Share of the saving (%)
Furnace firing and excess air38%
Pump around recovery24%
Stripping steam18%
Preflash and preheat12%
Pressure and cut points8%

See what the model finds in your plant.

A short call with our engineering team, your process data stays on site.